How I Built a DevTools Panel for Debugging postMessage
DevTools shows every request and none of the messages. So I built the missing panel.
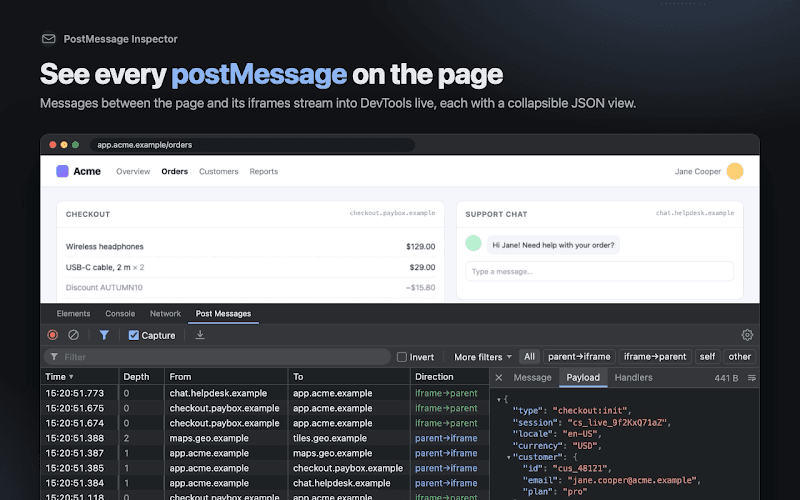
The panel that wasn't there
For the last couple of years I've worked on an online casino. If you've never looked inside one: the games aren't ours. Slots, live tables and the sportsbook come from third-party providers, and each of them lives in its own iframe. The only way those iframes talk to the host app is postMessage. Balance updates, "the round has started", "open the cashier", "the session expired" — all of it is messages flying between windows.
And DevTools has nothing for them.
Think about how good the Network panel is. Every request, in order, with timing, headers, a payload viewer, a filter, "preserve log". Now think about what you get for postMessage: nothing. No list, no history, no way to see what a game sent thirty seconds ago before things broke.
So for a long time my debugging looked like this: find the listener, add a console.log, reload, reproduce, realise the message I need arrives in a different frame, switch the console context to that frame, add another console.log, reload again. Every time.
At some point I got tired enough to build the panel myself. This post is about how it works inside and the mistakes I made along the way.
The 10-line version
You can get surprisingly far with a console snippet:
window.addEventListener(
  'message',
  (e) => {
    const from =
      e.source === window ? 'self' : e.source === window.parent ? 'parent' : 'child / other';
    console.log('%cmessage', 'color:#2563eb', { origin: e.origin, from, data: e.data });
  },
  true, // capture phase: runs before the page's own listeners
);
I used something like this for months. It's also a good way to see everything the real extension has to solve, because this snippet:
- works in one frame — the one selected in the console context dropdown;
- disappears on reload, and misses everything sent before you pasted it;
- gives you a wall of logs with no filter, no history and no export;
- tells you what arrived, but not who handled it.
Each of those turned into a part of the extension.
Mistake #1: listening on the wrong side
My first idea was to catch messages where they're sent. Wrap postMessage, log the arguments, call the original. Sending and receiving in one place, with the target window and targetOrigin for free.
The first version did exactly that:
const original = Window.prototype.postMessage;
Window.prototype.postMessage = function (message, targetOrigin, transfer) {
  log({ message, targetOrigin });
  return original.apply(this, arguments);
};
It shipped in March. In October, while adapting the extension for Firefox, I found out it had never run once.
Window.prototype.postMessage is undefined. Window is a global interface, and for globals the Web IDL rules put the methods on the object itself, not on its prototype. My hook quietly wrapped nothing, and for seven months the extension only ever showed incoming message events. Nobody noticed, including me, because incoming events were what I actually looked at.
The obvious fix — patch window.postMessage instead — turned out to be worse. The browser fills in event.source from whoever called postMessage (the "incumbent" realm). If a same-origin frame calls my wrapper, and the wrapper was created inside the target window, the browser now considers the target to be the caller. Same-origin frames suddenly receive messages "from themselves", and any code that checks event.source breaks.
That's when the main rule of the extension appeared: observe, don't modify. The page must behave exactly as it does without the extension installed. I deleted the send hook and went all in on the receiving side.
Receiving turns out to be enough. Every message ends up as a message event in some window, so if you listen in every frame, you see every message.
Try it: this page installs the same prototype hook and, next to it, a plain message listener. Send messages from the frame or from the page itself and see which of the two ever notices.
import { useEffect, useRef, useState } from 'react';
import './styles.css';

// Read before the hook below is installed.
const ON_PROTOTYPE = typeof Window.prototype.postMessage;
const ON_WINDOW = Object.hasOwn(window, 'postMessage');

// A third-party "game" frame that reports the balance to its parent.
const FRAME = `<button>Bet 10 (posts to parent)</button>
<script>
  let balance = 100;
  document.querySelector('button').onclick = () => {
    balance -= 10;
    parent.postMessage({ type: 'balance:changed', amount: balance }, '*');
  };
</script>`;

export default function App() {
  const [log, setLog] = useState([]);
  const frame = useRef(null);
  const add = (line) => setLog((l) => [...l.slice(-7), line]);

  useEffect(() => {
    // ❌ Idea 1: catch messages where they're sent.
    const original = Window.prototype.postMessage;
    Window.prototype.postMessage = function (message) {
      add(`[hook] saw postMessage(${JSON.stringify(message)})`);
      return original.apply(this, arguments);
    };

    // ✅ Idea 2: listen where they arrive.
    const onMessage = (event) => {
      // Only our frame and this page: the playground itself also talks to this window.
      if (event.source !== frame.current?.contentWindow && event.source !== window) return;
      add(`[listener] message event: ${JSON.stringify(event.data)}`);
    };
    window.addEventListener('message', onMessage);

    return () => {
      delete Window.prototype.postMessage;
      window.removeEventListener('message', onMessage);
    };
  }, []);

  return (
    <main>
      <ul className="facts">
        <li><code>typeof Window.prototype.postMessage</code> → <b>{ON_PROTOTYPE}</b></li>
        <li><code>Object.hasOwn(window, 'postMessage')</code> → <b>{String(ON_WINDOW)}</b></li>
      </ul>
      <div className="row">
        <iframe ref={frame} title="game" srcDoc={FRAME} />
        <button onClick={() => window.postMessage({ type: 'ping' }, '*')}>window.postMessage to self</button>
      </div>
      <ol className="log">
        {log.length ? log.map((line, i) => <li key={i}>{line}</li>) : <li>Nothing yet. Send a message.</li>}
      </ol>
    </main>
  );
}
Getting into every frame
Chrome extensions can inject content scripts into all frames of a page, including about:blank ones and iframes added later:
{
  "matches": ["<all_urls>"],
  "js": ["content-scripts/interceptor.js"],
  "run_at": "document_start",
  "all_frames": true,
  "match_about_blank": true,
  "world": "MAIN"
}
document_start matters: the script runs before any page script, so its capture-phase listener is registered first and nothing slips past it. Each frame reports its own URL, origin and depth (how many parent hops to the top), so the panel can show where a message landed.
Two worlds and a JSON string
There's a catch in that config: "world": "MAIN".
Content scripts normally live in an isolated world: they share the DOM with the page but have their own JavaScript globals. That's great for safety, but it means they can't see the page's objects — and later I needed exactly that (more on it below). So the interceptor runs in the main world, alongside page scripts.
The main world, however, has no chrome.* APIs. It can't talk to the extension. So there's a second, tiny script in the isolated world, and the two pass data through the only thing they share — the DOM:
interceptor.js  (MAIN world, sees the page)
      │  document.dispatchEvent(new CustomEvent(...))
      ▼
injector.js     (ISOLATED world, has chrome.*)
      │  chrome.runtime.sendMessage()
      ▼
service worker  (per-tab buffer, 5 000 entries)
      │  long-lived port
      ▼
DevTools panel
The detail of that CustomEvent is a JSON string, not an object. That came from the Firefox port. Firefox exposes main-world objects to the isolated world through Xray wrappers, and those wrappers can drop fields or refuse to be cloned into runtime.sendMessage. Messages arrived in the panel half-empty. Serialising to a string on one side and parsing on the other made both browsers behave the same.
The service worker keeps a ring buffer per tab. When you open DevTools, the panel connects with a port, gets a snapshot of everything captured so far, and then receives new entries live. That's how you can open the panel after the bug happened and still see the messages that led to it — the thing the console snippet could never do.
Turning any message into something you can show
postMessage uses the structured clone algorithm, which accepts much more than JSON: ArrayBuffers and typed arrays, Map, Set, Date, Error, MessagePorts, circular references. A naive JSON.stringify(event.data) either throws or silently loses data.
So the interceptor walks the payload itself and produces a JSON-safe copy:
if (tag === '[object ArrayBuffer]') {
  return { __type: 'ArrayBuffer', byteLength, bytesPreview: firstBytes(64) };
}
if (tag === '[object MessagePort]') return '[MessagePort]';
if (seen.has(v)) return '[circular]';
if (depth >= depthLimit) return `[max-depth:${tag}]`;
And it has limits: string length, array items, object keys, depth. Game messages can be large — think a full game state on every tick — and copying megabytes per message through three hops would make the panel and the page sluggish.
The first version had these limits hard-coded, and one of them bit a real user. A review on the Chrome Web Store said, roughly: great extension, but it crops long strings — even in the exported JSON.
They were right, and the "even in the export" part was the interesting bit. Strings were cut at 2,000 characters at capture time, inside the page. Everything downstream — the panel, the JSON viewer, the export — only ever saw the shortened copy. Whatever you drop at the first hop is gone for good, no matter how good the rest of the pipeline is.
The fix shipped eleven days later in 0.2.0: the default string limit went up to 10,000 characters, and every limit — string length, array items, object keys, depth, binary preview — became configurable in the panel, where 0 means "no limit". I replied to the review when it went live. It's still my favourite kind of bug report: short, specific, and pointing at a design mistake rather than a typo.
The question I really wanted answered: who handled it?
Seeing a message is half of the story. The other half is: which code reacted to it? With several SDKs on a page, the answer is rarely obvious. That's what the Handlers tab answers: for every message it lists the listeners the receiving window had at that moment, where each one was registered, and its source.
That's the reason the interceptor lives in the main world. To know about listeners, it has to see addEventListener calls made by the page. So it wraps addEventListener — but only for bookkeeping. The native method is always called with the original arguments:
EventTarget.prototype.addEventListener = function (type, listener, options) {
  if (type === 'message' && listener && this === window) {
    record(listener, options, captureStack());
  }
  return Reflect.apply(nativeAddEventListener, this, arguments);
};
The simple version is easy. Making it match what the browser really does took most of the time:
- Grab natives first.
addEventListener,Reflect.apply,Function.prototype.toStringandErrorare saved atdocument_start, before any page script can override them. - Same key as the browser. The browser ignores a second
addEventListenerwith the same function and the samecaptureflag, andremoveEventListenermust match both. The registry is keyed the same way, or the list drifts from reality. onceandAbortSignal. A{ once: true }listener disappears after its first message, and a listener withsignaldisappears when the signal aborts. Both are mirrored.window.onmessage. Assigningonmessagegoes through a setter, so that's patched too. Re-assigning it keeps the handler's original position in the dispatch order, just like in the browser.- Dispatch order. Capture listeners first, then the rest, each group in registration order.
Stack traces that don't lie
"Where was this listener registered?" means capturing a stack trace inside addEventListener. new Error().stack sounds trivial until a page loads an error-tracking SDK. Many of them override Error.prepareStackTrace to format stacks their own way, and Error.stackTraceLimit is 10 by default, which a framework-heavy page eats before reaching your code. So the interceptor temporarily resets both:
const limit = NativeError.stackTraceLimit;
const prepare = NativeError.prepareStackTrace;
NativeError.stackTraceLimit = 30;
NativeError.prepareStackTrace = undefined;
const stack = String(new NativeError().stack || '');
NativeError.stackTraceLimit = limit;
NativeError.prepareStackTrace = prepare;
Each location in the Handlers tab is clickable and opens the file in the Sources panel through chrome.devtools.panels.openResource. My first try opened every file one line below the right place. openResource counts lines and columns from 0, stack traces count from 1.
Most messages aren't yours
The first time I opened the panel on a regular page, I got a surprise: a lot of what you see has nothing to do with your app. React DevTools talks to the page through postMessage. So do Redux and Vue DevTools, webpack-dev-server, wallet extensions like MetaMask, reCAPTCHA, ad iframes.
So the panel has noise rules: built-in ones for the usual suspects, and your own by origin or by a payload field. Right-click a message and "hide messages like this" creates a rule. Turning noise filtering off doesn't make the noise vanish or reappear abruptly — it's shown dimmed, so you can still tell it apart.
Shipping it
A few decisions I'm happy with:
- Zero dependencies, no build step. Plain JavaScript, nothing to bundle. For a tool that runs inside every page you open, less code you didn't write is a feature.
- Fewer permissions over time. The first manifest asked for
debugger, which I never used — removed. Latertabswent too, so the extension no longer asks for access to your browsing activity. What's left isactiveTab,storage, and host access for the content scripts. - Firefox. One manifest for both browsers (Firefox 140+, Chrome 121+). The Xray story above was the biggest part of the port.
- It looks native. The panel copies the Network panel layout and follows the DevTools theme, not the OS one — they can differ.
What the Handlers tab made me notice
Once I could see the source of every message handler, I couldn't unsee one thing: how often a handler acts on a message without checking where it came from. That's not a style issue. Any window that can get a reference to yours can send you a message, and an unchecked handler will trust it.
That's what part 2 is about: checking event.origin the right way, the checks that look fine but aren't, and what I plan to teach the inspector to flag automatically.
If you work with iframes, give it a try: PostMessage Inspector for Chrome or Firefox. The project page has a tour of the features.

Frontend Developer · React, TypeScript, Next.js
Have a question, spotted a mistake or see it differently? I'd genuinely like to hear it.
interview questions on this
view allrelated posts
view all- When to Use WebSockets (and When You Don't Need Them)If the browser barely talks back, you probably want something simpler.Nov 9, 2026 · 13 min
- postMessage Security: Checking event.origin the Right WayA message handler without an origin check is an open API.Nov 7, 2026 · 8 min
- Best AI for Coding in 2027: Models, Tools and Real Costs"Which AI is best for coding?" is the wrong question. Here are the three right ones.Nov 7, 2026 · 12 min